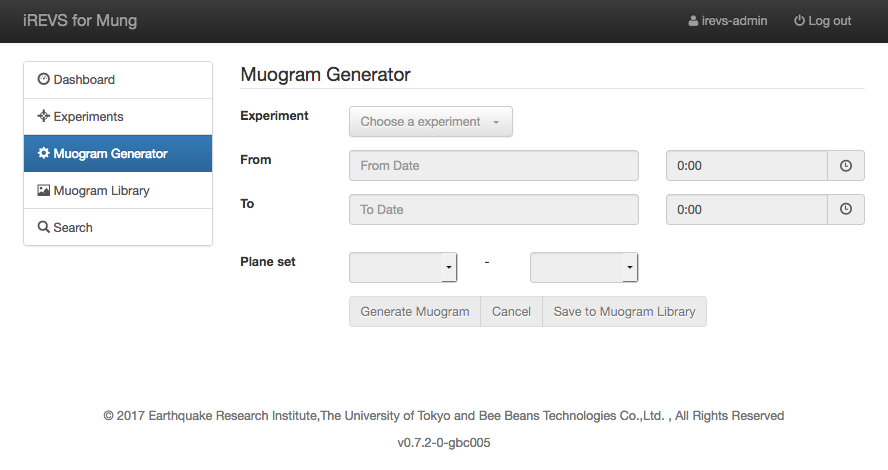
"Muogram Generator" can generates the Muogram by specifying the experiment, the period and the plane set.
You can save the generated Muogram in the Muogram Library and refer to it later and save it as the csv file.
If you don't belong to the experimental group, you cannot use the Muogram generator(Waring will be displayed).
How to generate Muogram and save it
- Select the experiment in "Experiment" pull-down menu.
- Select start and end time in From, To pull-down menu.
- Select start and end Plane Sets like 1-6.
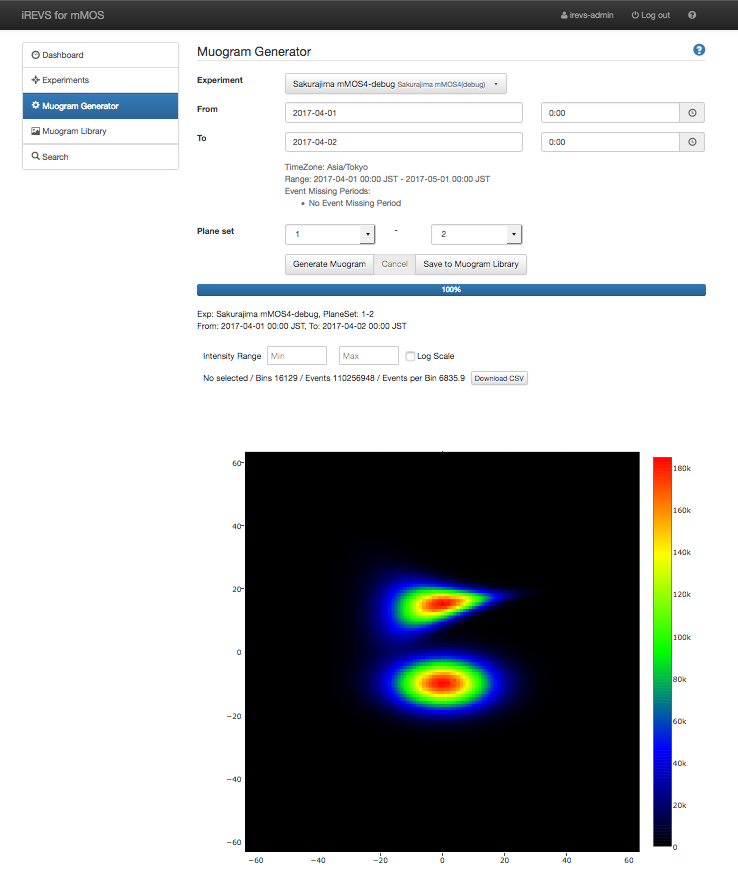
- Click [Generate Muogram] button to generate the Muogram.
- Click [Save to Muogram Library] button to open dialog to save the generated Muogram in the Muogram Library.
- Enter Tittle and Summary
- Edit Description. The Description is displayed in Muogram detailed information.
- You can specify the publish conditions of generated Muograms at Visible Group and the editable user group of generated Muograms at Editable Group. For details, Refer to Permission.
- If you save the generated Muogram, push [Save] button. If you cancel generating Muogram, push [Cancel] button.
Click [Cancel] button to stop generating Muogram(cannot resume).
*The Muogram is generated in the browser. Closing the browser before saving the Muogram in the Muogram library will cause the result to disappear.
Range of experiment and Event Missing Periods are displayed below "To" field.
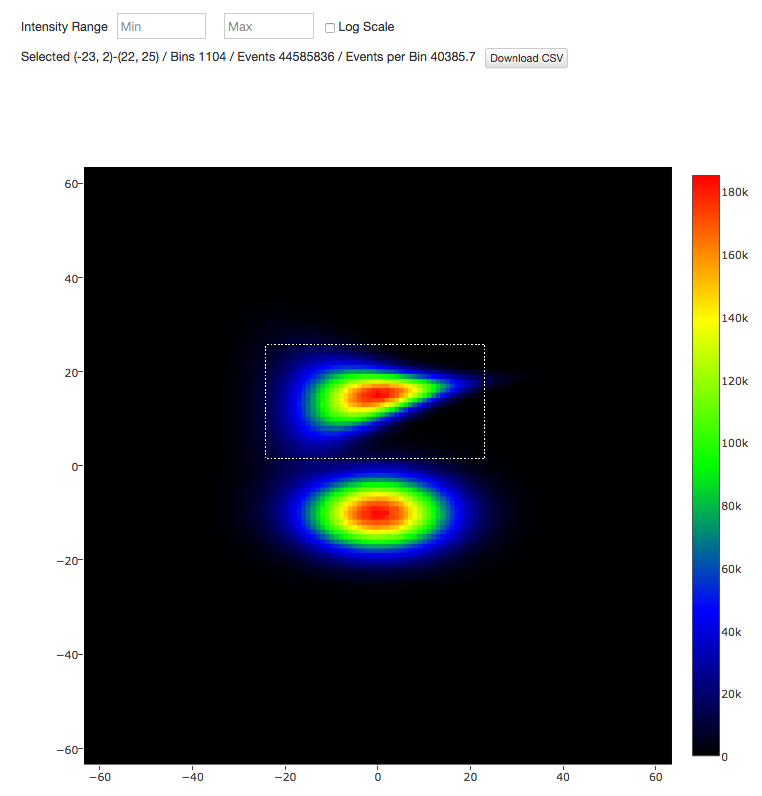
With the Intensity Range, you can edit the Min / Max field to change the colormap of minimum and maximum value.
By checking Log Scale check box, you can display a colormap in log scale. Or in linear scale.
By pushing Download CSV button, you can download the graph value as a csv file.
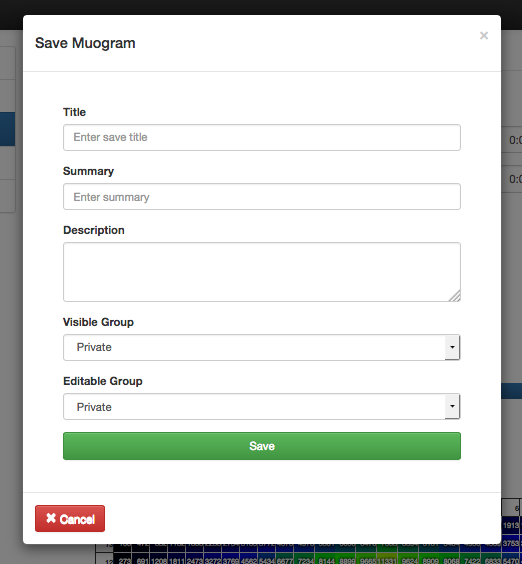
Title and Summary are displayed with thumbnail in the Muogram Library.
Title is a necessary item for saving Muogram.
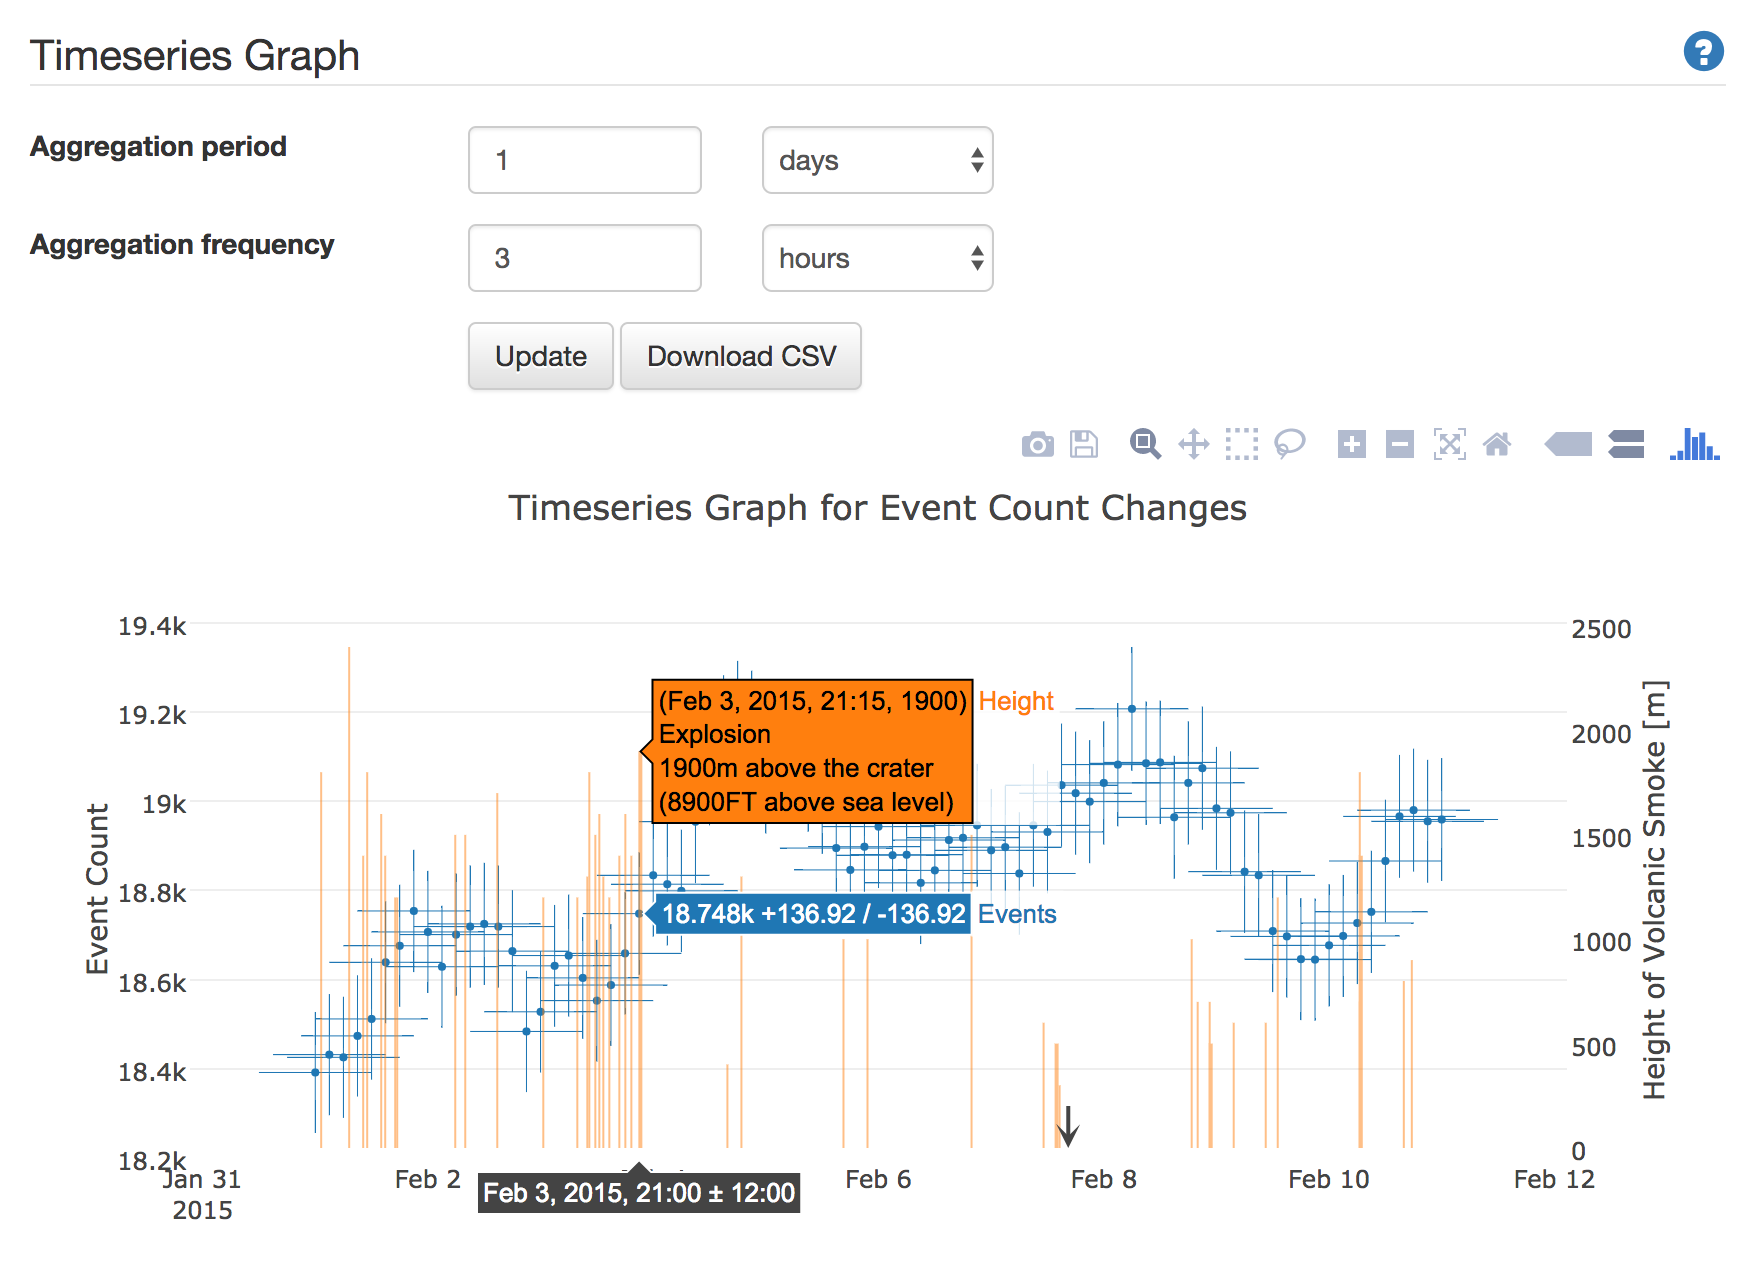
In the Timeseries Graph, you can view the change over time in the number of events by specifying the aggregating period and aggregation frequency for Muogram specified bin range (region of interest) created by Muogram Generator.
To specify the bin range, drag Muogram.
To cancel specifying the bin range, double click Muogram at any position.
When you specify the bin range, bin information is displayed above Muogram.
From the left, the bin information shows the coordinates of the selection range, the number of bins, the total number of events in the bin range, and the average number of events (per bin).
If you don't specify the bin range, the time series graph of the entire Muogram is displayed.
Click Update button after selecting Aggregation period and Aggregation frequency.
Each setting item, buttons are as follows.
- Aggregation period :
- Aggregation frequency :
- Update button : Display and update the graph.
- Download CSV button : Download the graph value as a csv file.
You can specify the total period of number of events in each plot.
For example, if you set "Aggregation period" to 1 days, the total number of events is 24 hours.
Set the number in the text box and select days/hours/minutes from the pull-down menu.
You can specify how long the plot of the graph should be placed.
For example, when you set "Aggregation frequency" to 3hours, the gap of plot is 3 hours.
Input the number in the text box and select days/hours/minutes from the pull-down menu.
Aggregation period and aggregation frequency are truncated every 10 minutes. If you specify 35 minutes to them, it is calculated as 30 minutes. If you specify less than 10 minutes, it is round up to 10 minutes.
Click Update button to displaye the time series change graph (blue plot) of event number, and the graph (orange bar graph) of the volcanic smoke height when the eruption occurs.
The left virtical axis represents the number of events and the right virtical axis represents the hight of the volcanic smoke, and the horizontal axis represents the date.
The blue plot represents the number of events that set at "Aggregation period", "Aggregation frequency".
The vertical error bar represents the square root of number of events, the horizontal error var represents the aggregation period.
When you hover the mouse cursor on the plot, you can view the number of events, the range of error of number of events, date and time and the total period of events(±time).
When you hover the mouse cursor on the bar, you can view the date and time of eruption, the height of the volcanic smoke(elevation and above sea level).