Experiment details show summary information, event missing period, Statistics Muogram, statistics, Daily Muogram of the experiment.
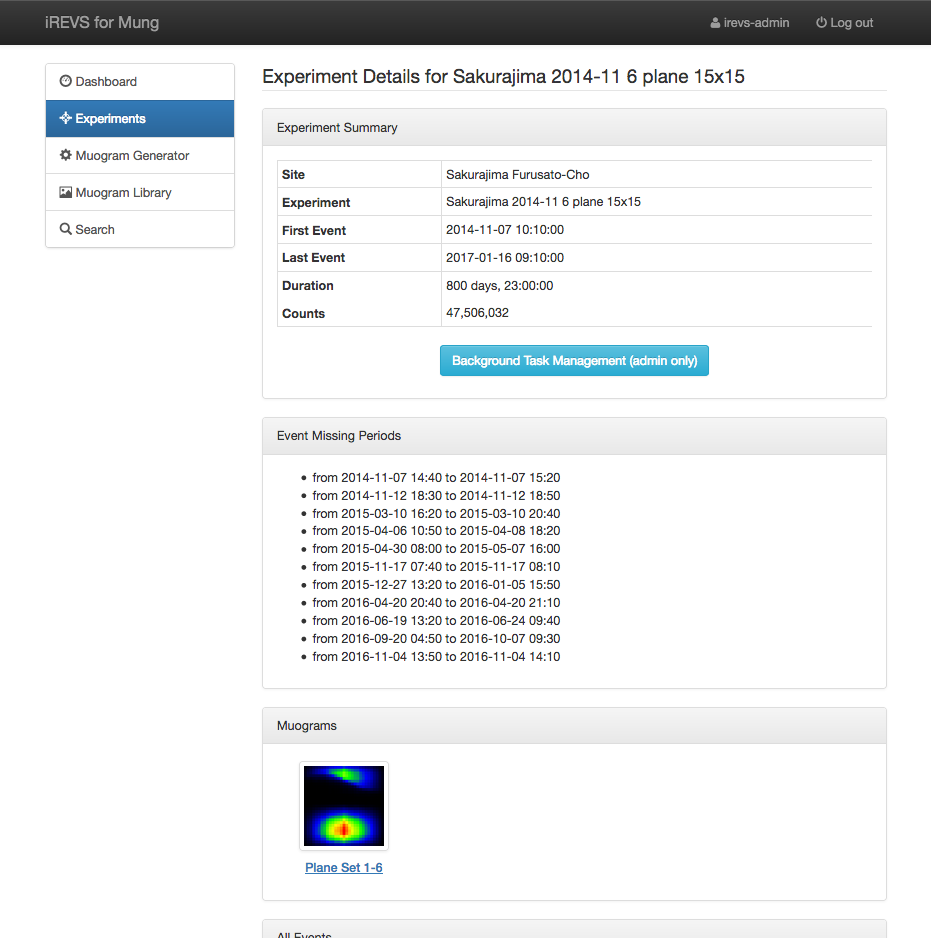
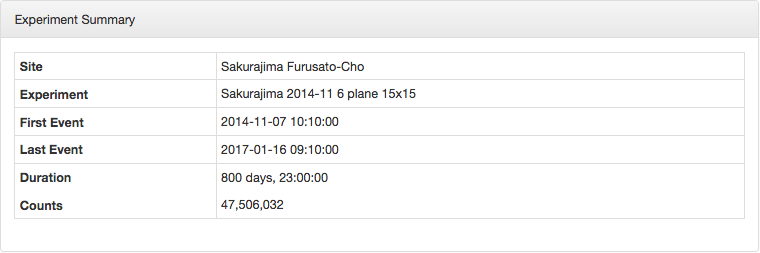
Experiment summary panel displays the overview of the experiment.
Experiment Summary
- Site : Location of the experiment.
- Experiment : Link to each experiment. It is made up of "Location of the experiment - Start date of the experiment - The number of planes - The number of pixels of detector".
- First Event : Date and time of the first event of the experiment.
- Last Event : Date and time of the last event of the experiment.
- Duration : The duration of the experiment.
- Counts : Total number of event detected in the experiment.
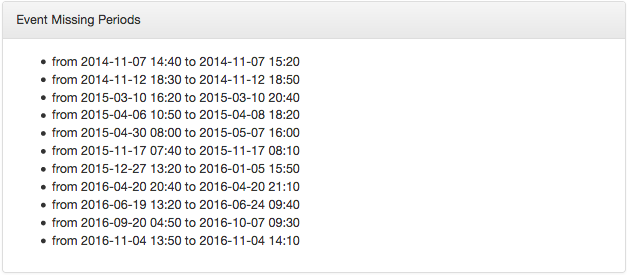
Event missing periods panel shows the missing period of the events caused trouble like power failure.
The missing period of the events consist in units of 10 minutes with no events.
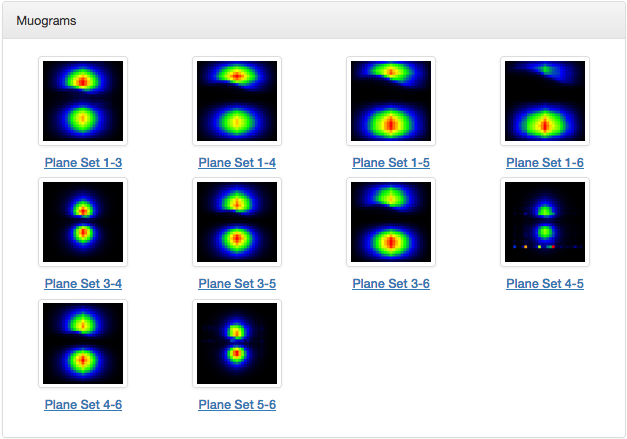
Muograms panel displays the total number of Muograms in the corresponding experiment.
Click a Muogram to display the detailed information of the corresponding Muogram.
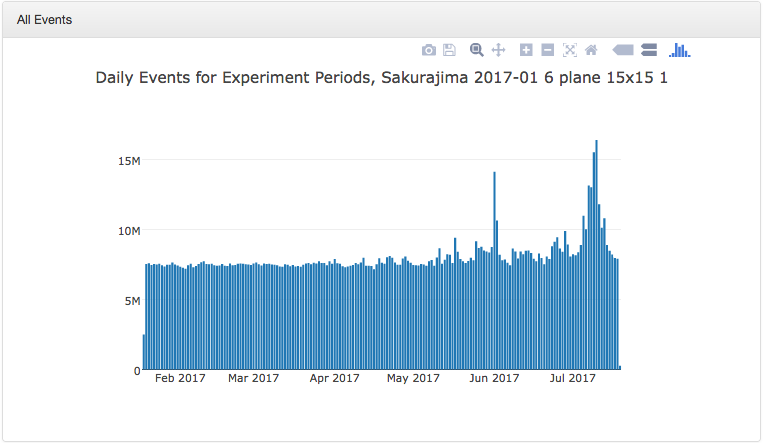
All events panel shows the number of events over the entire period of the corresponding experiment with a bar graph. Events are counted par day.
The vartical axis represents the number of events and the horizontal axis represents the period.
Daily plane event counts for a month displays the number of events in each month's corresponding experiment with a bar graph by plane.
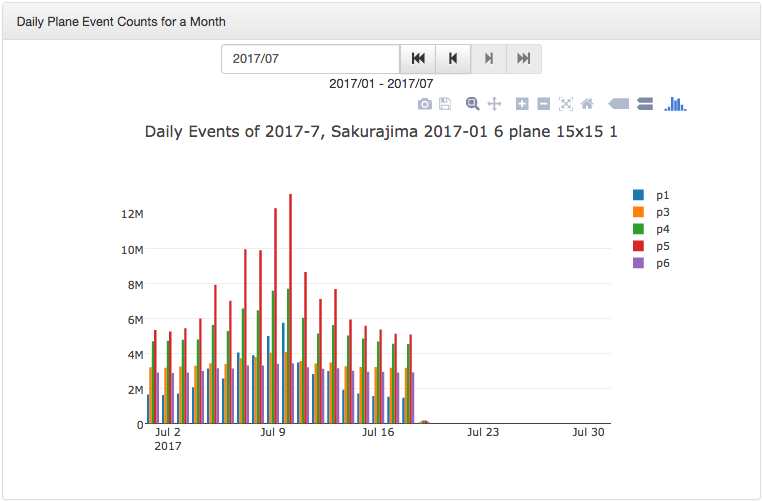
The vartical axis represents the number of daily event count and the horizontal axis represents date.
Click the legend for p1 to p6 to change the plane's event to show/hide.
Click the month input field above the graph to display the dialog to select the month.
You can also select the month with the button on the right side of month input field. The role of each button is as follows.
| # | Button | Description |
|---|---|---|
| 1 | Display the oldest month's data. | |
| 2 | Display the previous month's data. | |
| 3 | Display the next month's data. | |
| 4 | Display the most recent month's data. |
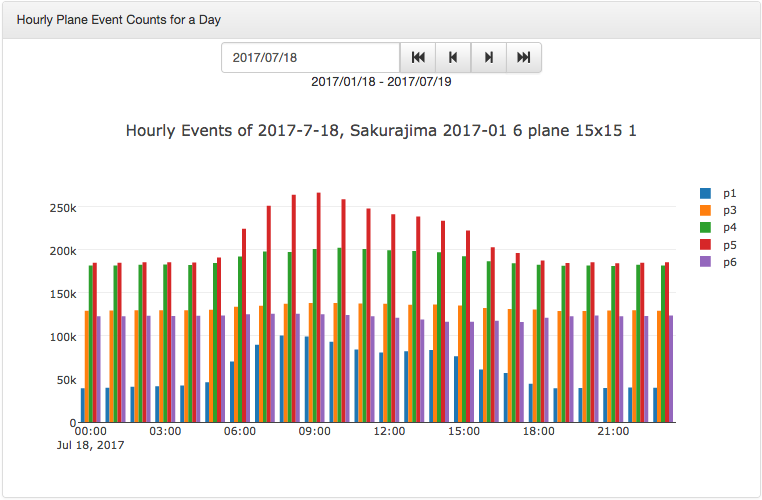
Hourly plane event counts for a day displays the number of events par day for the corresponding experiment with a bar graph by plane.
The vertical axis represents the number of event count par hour and the horizontal axis represents time.
Click the legend of p1 to p6 to change the plane's event to show/hide.
Click the day input field above the graph to display the dialog to select the day.
You can also select the day with the button on the right side of day input field. The role of each button is as follows.
| # | Button | Description |
|---|---|---|
| 1 | Display the oldest day's data. | |
| 2 | Display the previous day's data. | |
| 3 | Display the next day's data. | |
| 4 | Display the most recent day's data. |
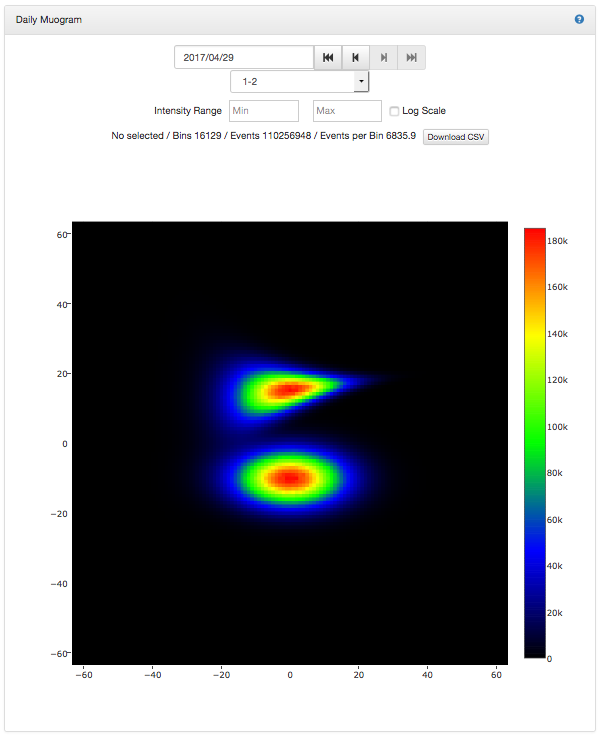
Daily muogram panel displays Muogram for each day of the corresponding experiment.
Click the month input field above the graph to display the dialog to select the month.
You can also select the month with the button on the right side of month input field. The role of each button is as follows.
| # | Button | Description |
|---|---|---|
| 1 | Display the oldest data. | |
| 2 | Display the previous month's data. | |
| 3 | Display the next month's data. | |
| 4 | Display the most recent data. |
The number displayed below the date is plane set. You can select the displaying plane set with pull-down menu.
About Intensity Range, Log Scale, Download CSV, refer to Muogram Generator>Intensity Range.
Bins information is displayed below Intensity Range.
Bins information indicates the number of bins, the total number of events, and the average number of events (per bin) from the left when bins ranges are not specified.
Please refer to Timeseries Graph for case of specifying bins range.
Also, if you select a day without an event, it will be displayed like "Sakurajima mMOS1 has no events."