"Density Graph" can generates the graph of density by specifying the period.
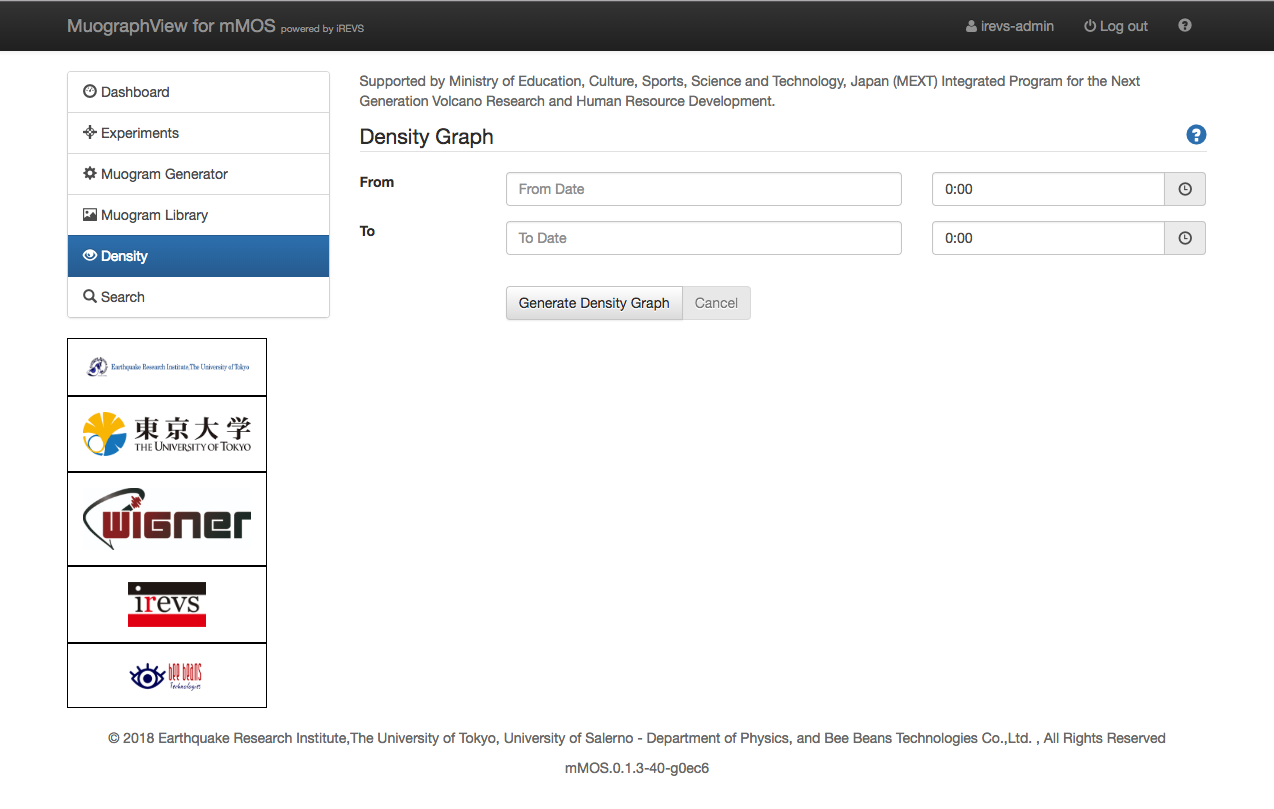
How to generate density graph
- Select start and end time in From, To pull-down menu.
- Click [Generate Muogram] button to generate the desntiy graph.
Click [Cancel] button to stop generating density graph(cannot resume).
*The density graph is generated in the browser. Closing the browser will cause the result to disappear the density graph.
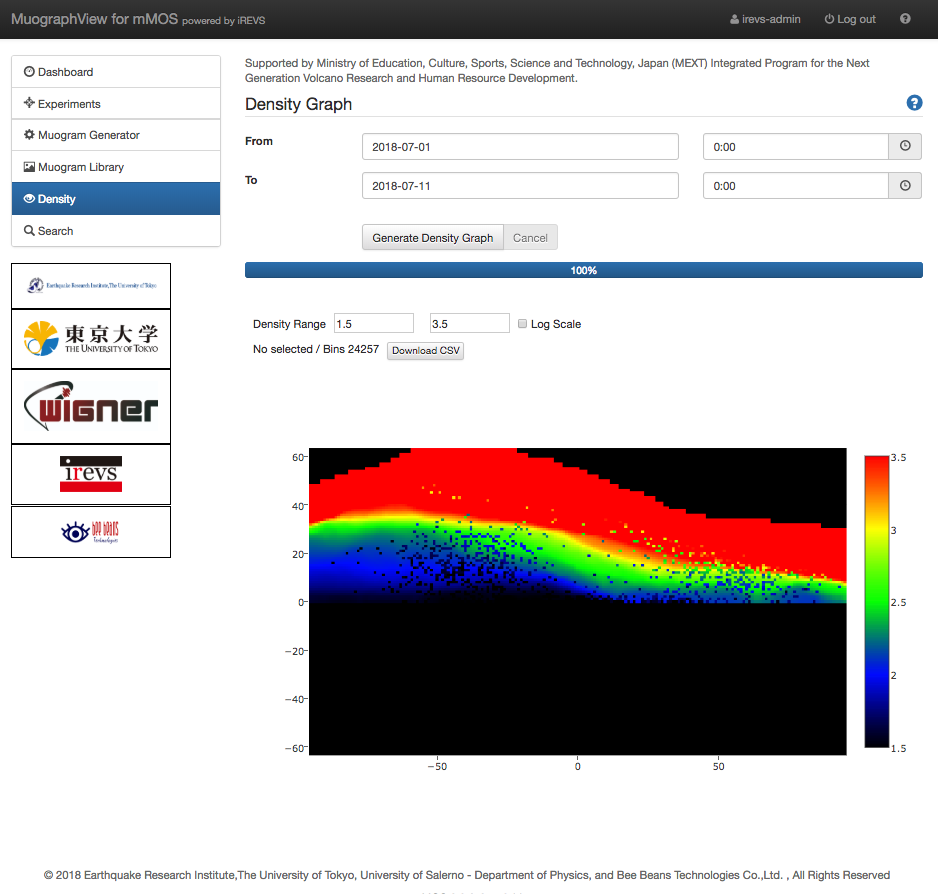
With the Intensity Range, you can edit the Min / Max field to change the colormap of minimum and maximum value.
By checking Log Scale check box, you can display a colormap in log scale. Or in linear scale.
By pushing Download CSV button, you can download the graph value as a csv file.